A PowerPoint presentation is a collection of slides. Each slide is a canvas with text boxes, shapes, pictures, tables, and charts. There are fancy things like animations, SmartArt, and video, but you don't need those for 90% of professional slides.
A PowerPoint file is the place where you store all of that
content for your computer to read. It contains things like the text
you typed for a chart title, embedded Excel files with your chart
data, .png files with your company logo, and the
properties that determine how everything renders on your screen. The
title's font size, the data labels' font colors, the row heights for
your table, and whether your chart shows gridlines.
How do you store all this information?
You could try writing everything down in a text file. List out every element and its properties.
Here's a dumb example: a blank slide with a single textbox that says "Hello world!"
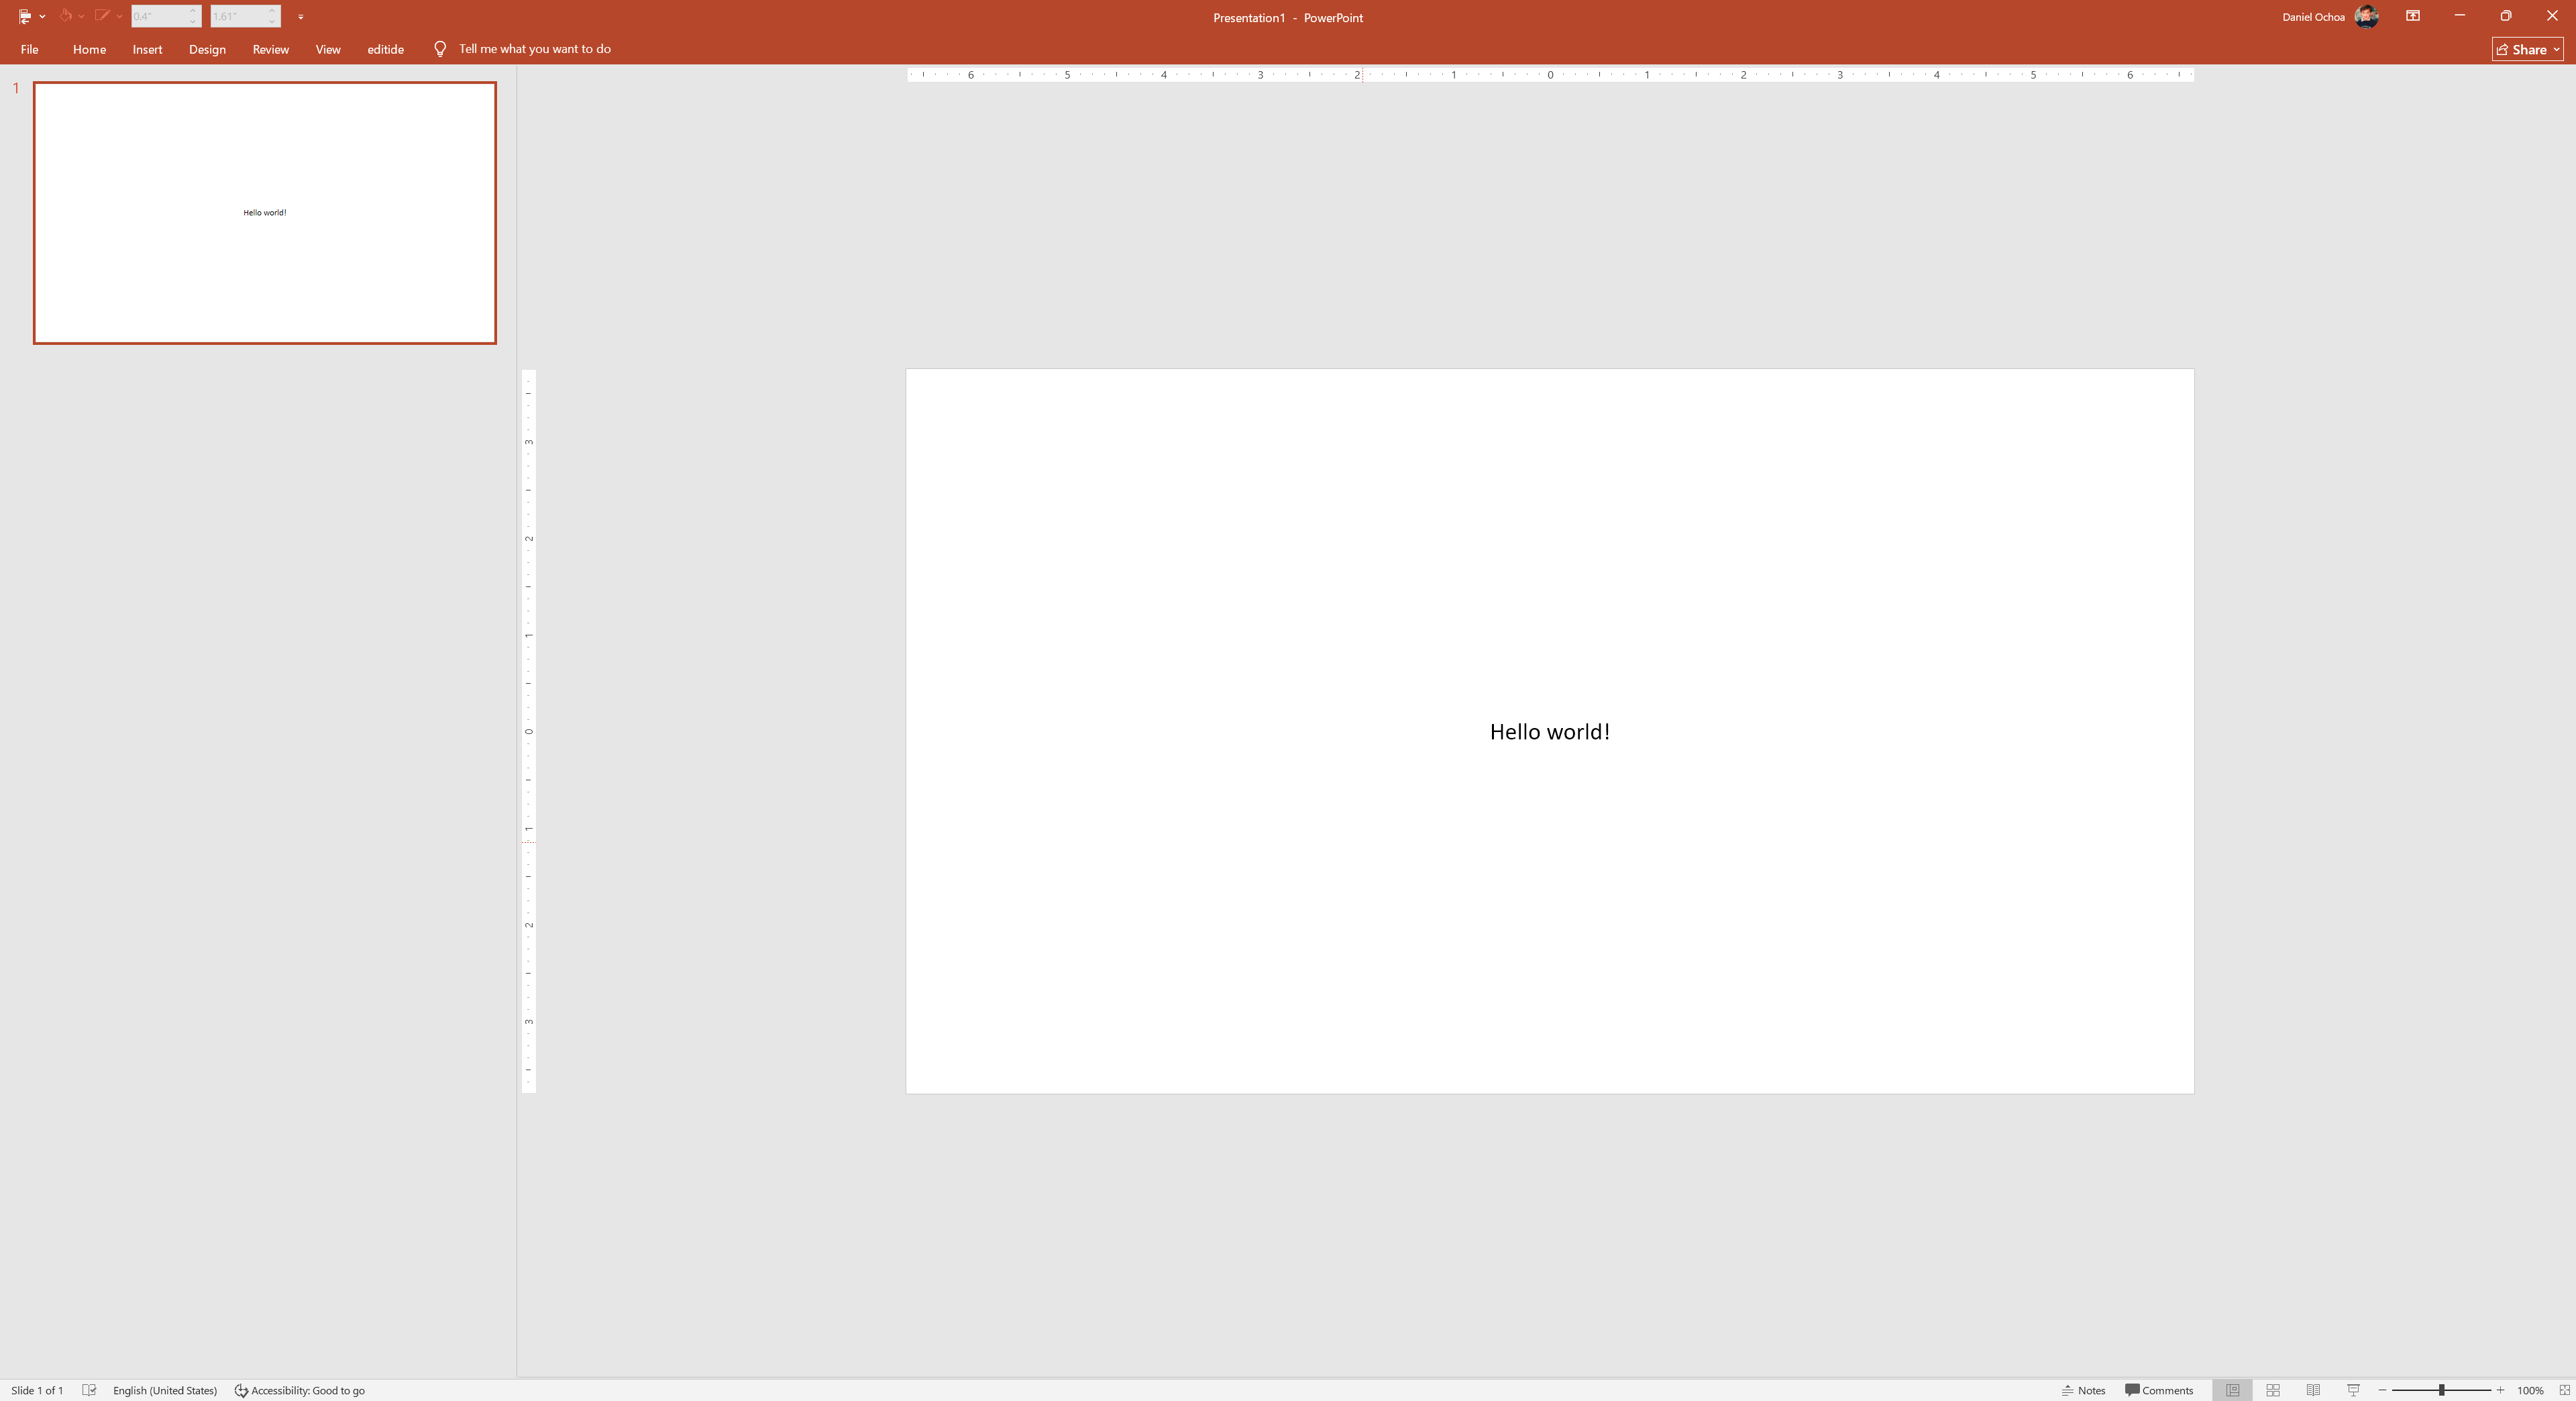
You could open up Notepad and type out a .txt file that
looks something like this:
Slide 1
- Width = 13.33 inches
- Height = 7.5 inches
- Background = white
- Text Box 1
  - Text = "Hello world!"
  - Font family = Arial
  - Font size = 18
  - Font color = black
  - Position = 5.9 inches from the left edge, 3.5 inches from the top edge
Let's say you add another dumb slide.
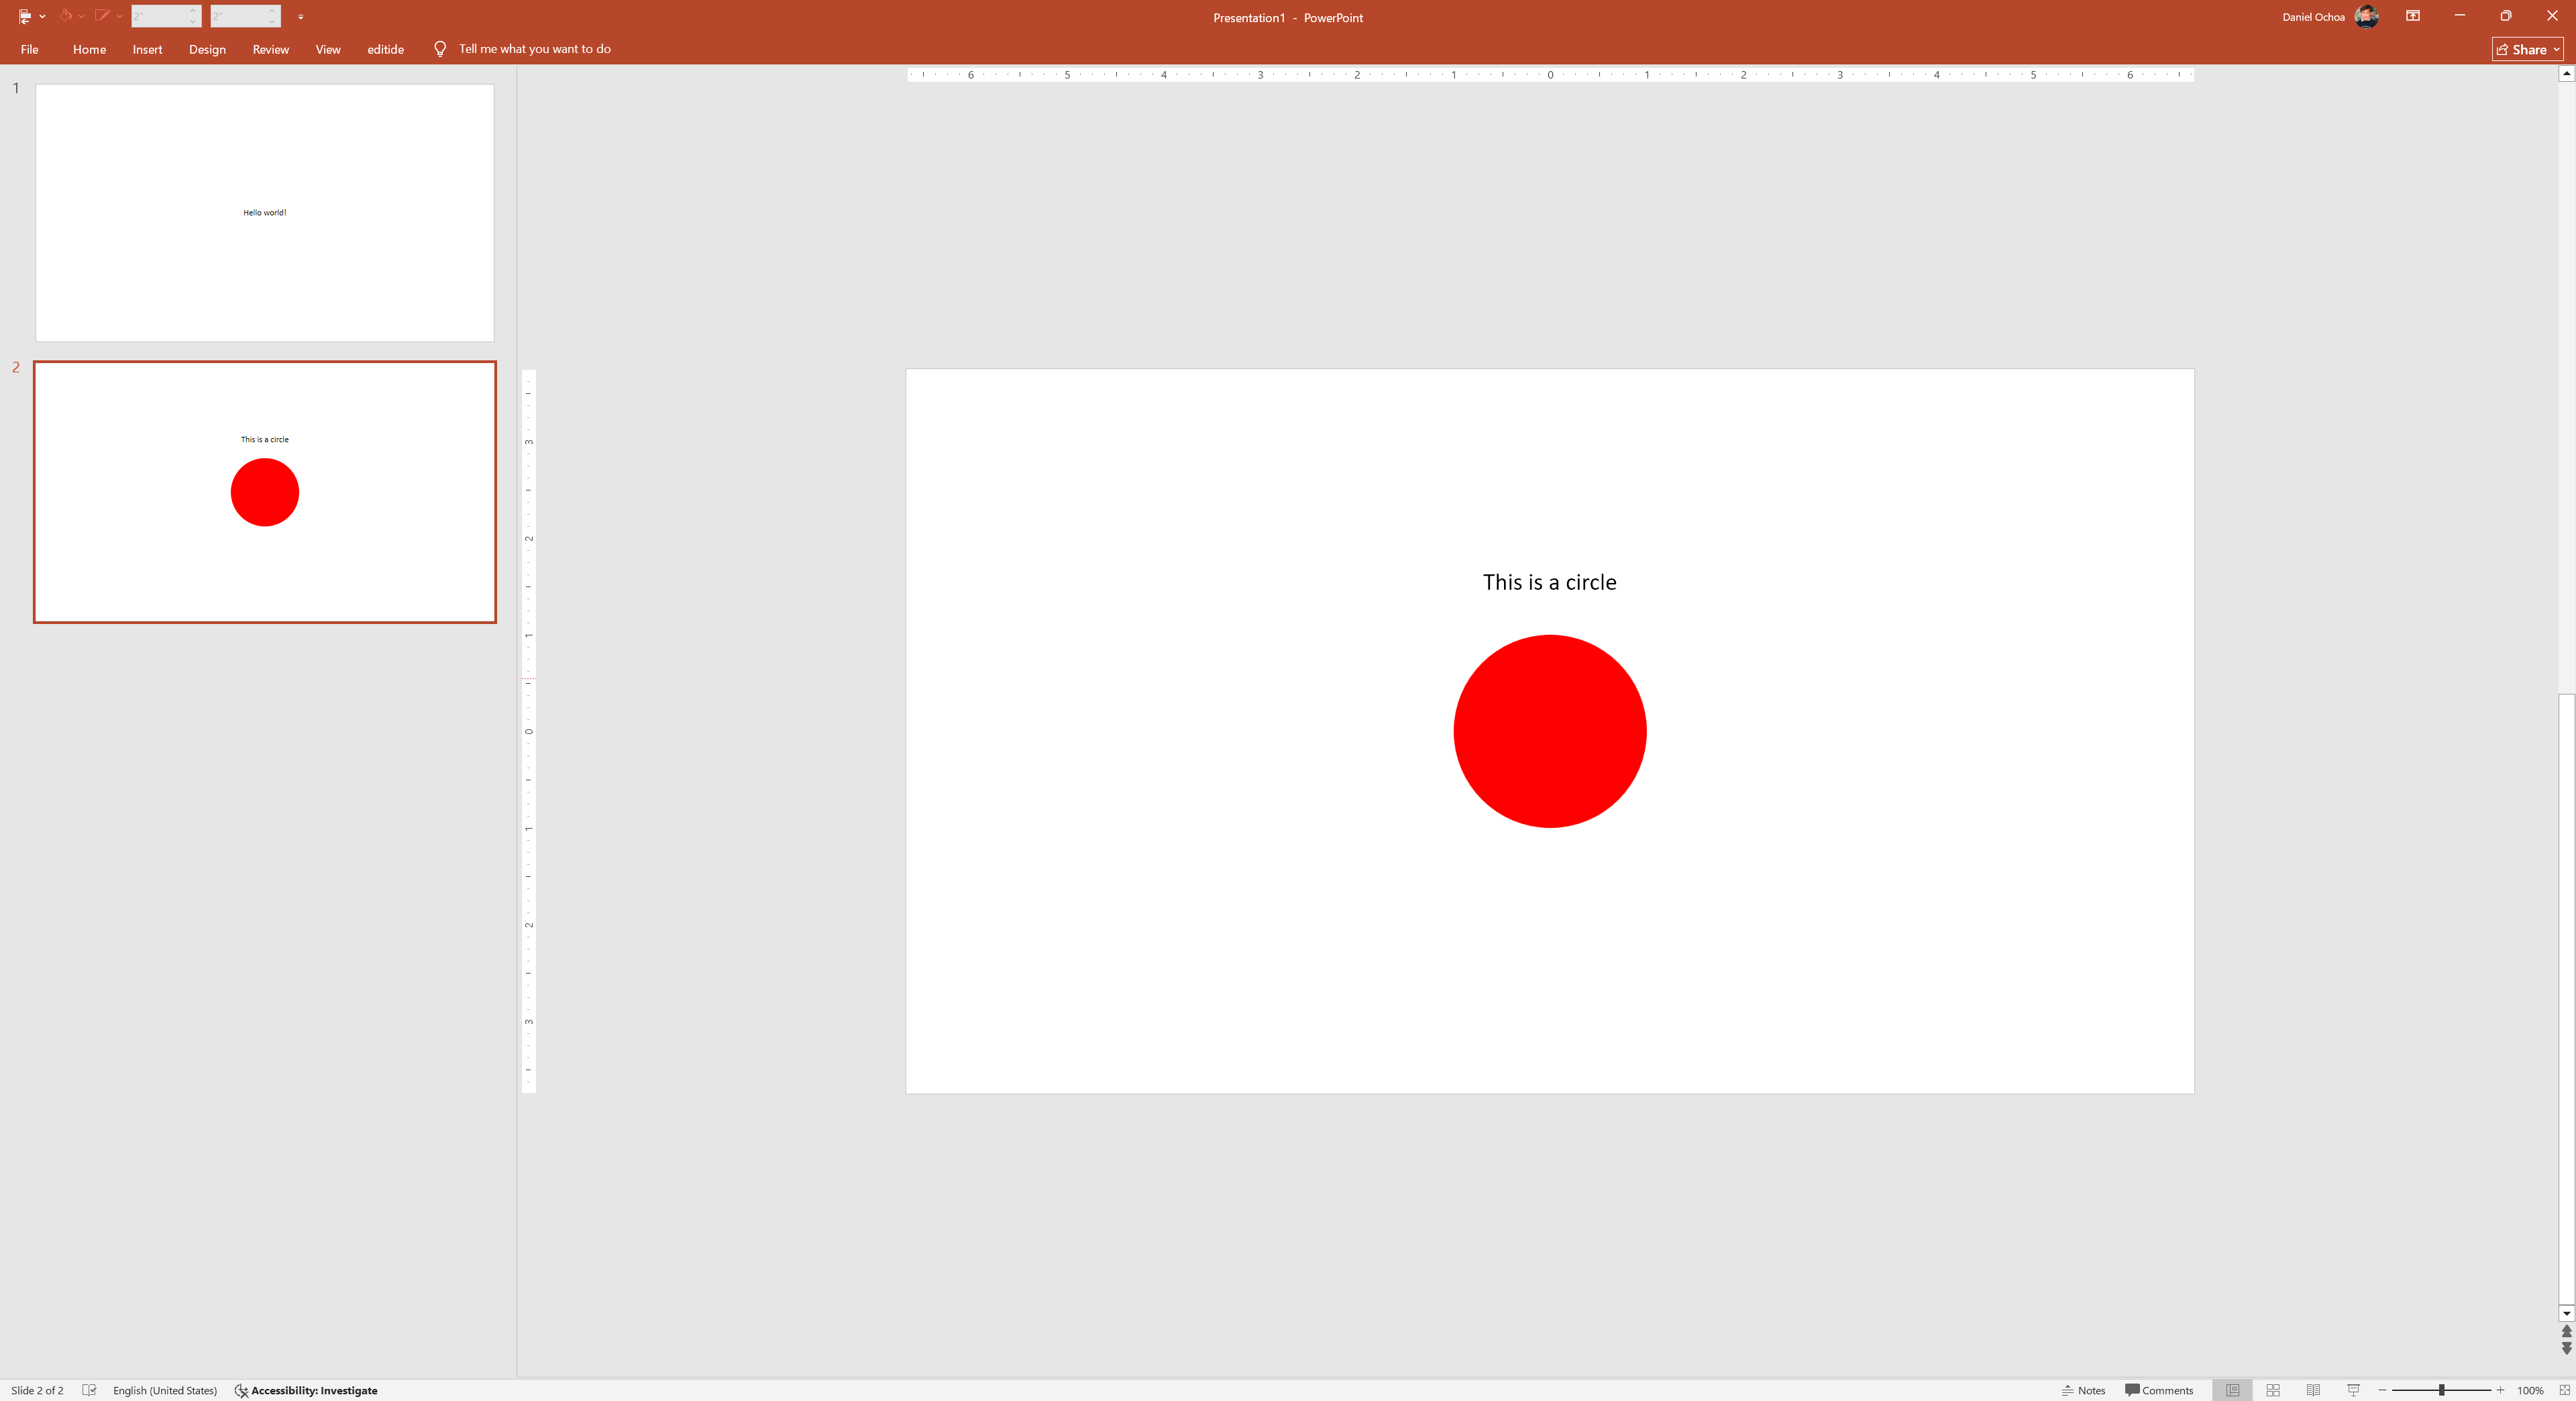
You would add this to your .txt file:
Slide 2
- Width = 13.33 inches
- Height = 7.5 inches
- Background = white
- Text Box 1
  - Text = "This is a circle"
  - Font family = Arial
  - Font size = 18
  - Font color = black
  - Position = 5.9 inches from the left edge, 2 inches from the top edge
- Shape 1
  - Shape type = circle
  - Fill = red
  - Height = 2 inches
  - Width = 2 inches
  - Position = 5.7 inches from the left edge, 2.75 inches from the top edge
You see this and think to yourself, "Hmm, I'm repeating some stuff that isn't going to change. Every slide has the same width, height, and I'm just going to use the same font. Let me consolidate."
Presentation
- Slide width = 13.33 inches
- Slide height = 7.5 inches
- Background = white
- Font color = black
- Font family = Arial
- Font size = 18

Slide 1
- Text Box 1
  - Text = "Hello world!"
  - Position = 5.9 inches from the left edge, 3.5 inches from the top edge

Slide 2
- Text Box 1
  - Text = "This is a circle"
  - Position = 5.9 inches from the left edge, 2 inches from the top edge
- Shape 1
  - Shape type = circle
  - Fill = red
  - Height = 2 inches
  - Width = 2 inches
  - Position = 5.7 inches from the left edge, 2.75 inches from the top edge
Better. But this file is going to be huge when you have a proper 30-page deck, so you decide to break it out into smaller files and group them into folders.
presentation/
├── presentation_properties.txt
└── slides/
    ├── slide1.txt
    └── slide2.txt
Charts and pictures
So far your slides only hold text and shapes. What about your company logo?
Since you're already working with folders, just add a
pictures folder and save the .png and
.jpg files in there.
presentation/
├── presentation_properties.txt
├── slides/
│   ├── slide1.txt
│   └── slide2.txt
└── pictures/
    └── logo.png
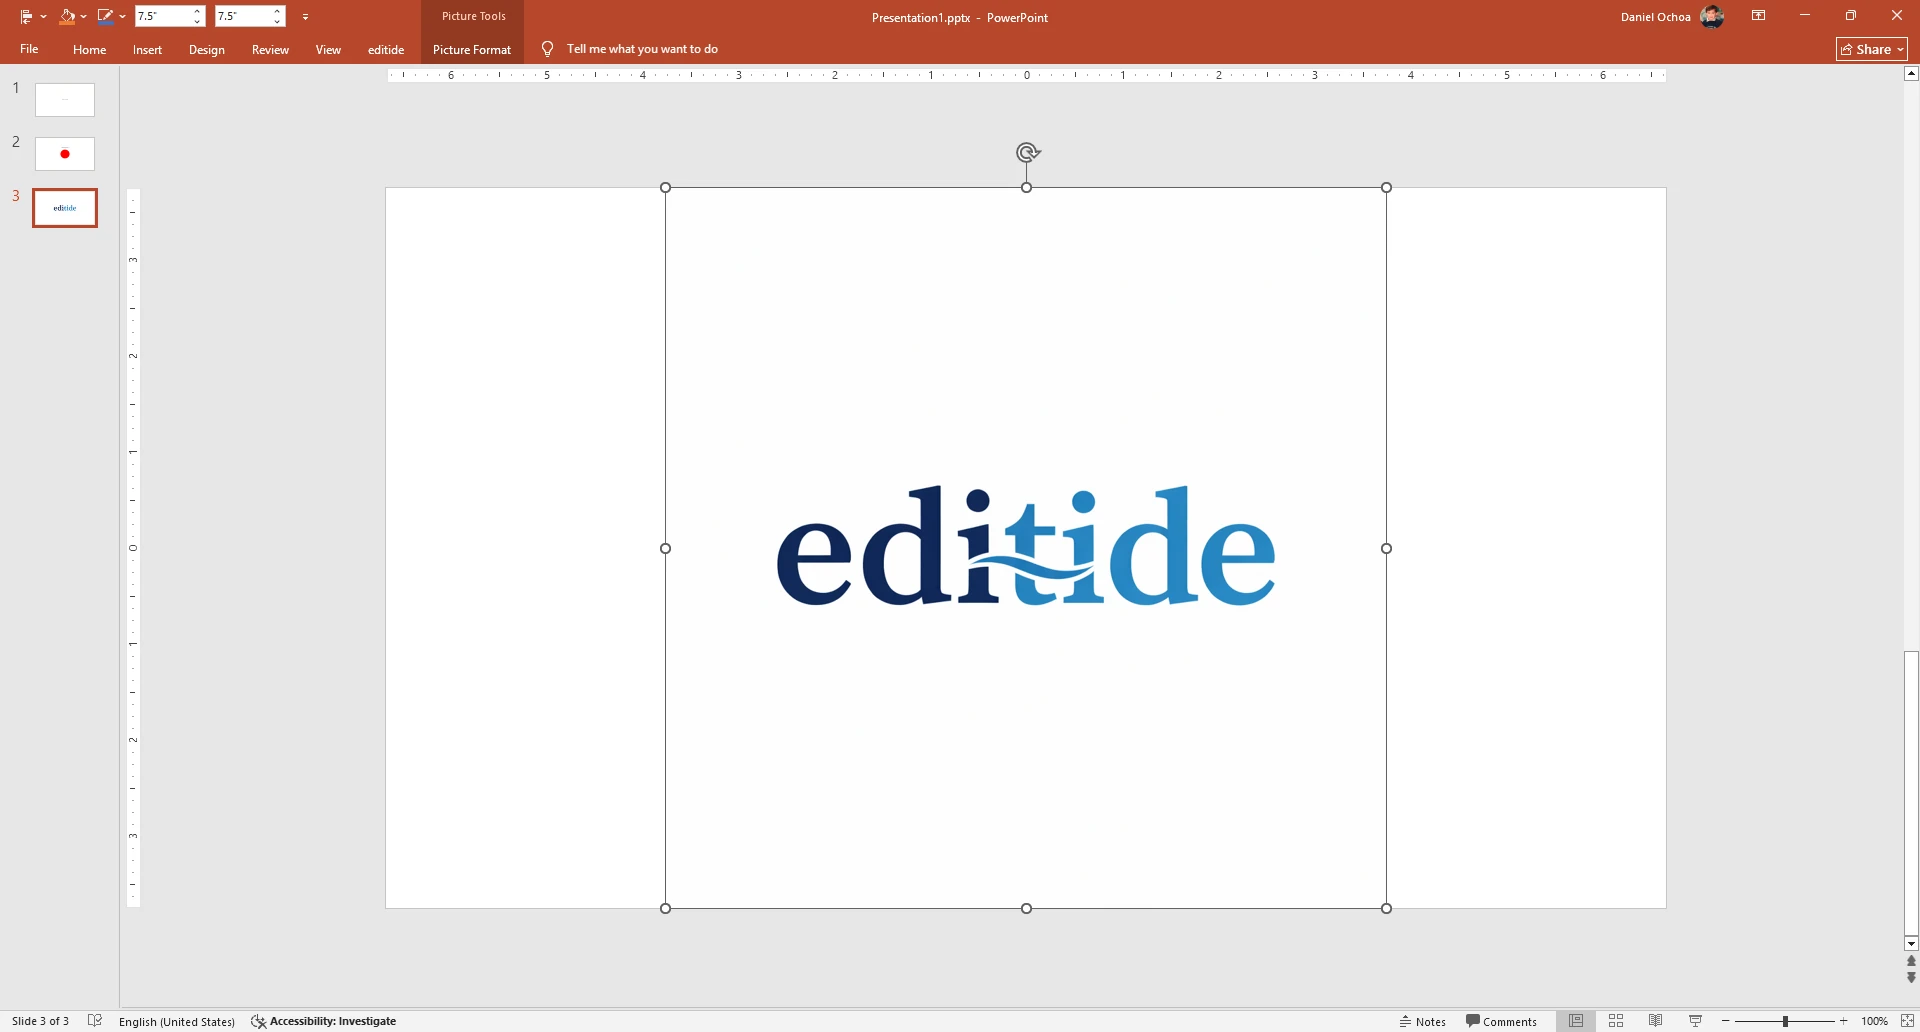
Then in your slide you just reference the picture file and specify the size and position.
The nice thing about this setup is that if you use the same logo on multiple slides, you don't have to save a copy of each picture.
Slide 3
- Picture
  - Source = logo.png
  - Height = 7.5 inches
  - Width = 7.5 inches
  - Position = 2.92 inches from the left edge, 0 inches from the top edge
You can use the same concept for charts. Excel files are convenient
for storing numerical data, so instead of reinventing the wheel you
assign each chart an .xlsx file for its data.
presentation/
├── presentation_properties.txt
├── slides/
│   ├── slide1.txt
│   ├── slide2.txt
│   └── slide3.txt
├── pictures/
│   └── logo.png
└── excel/
    └── book1.xlsx
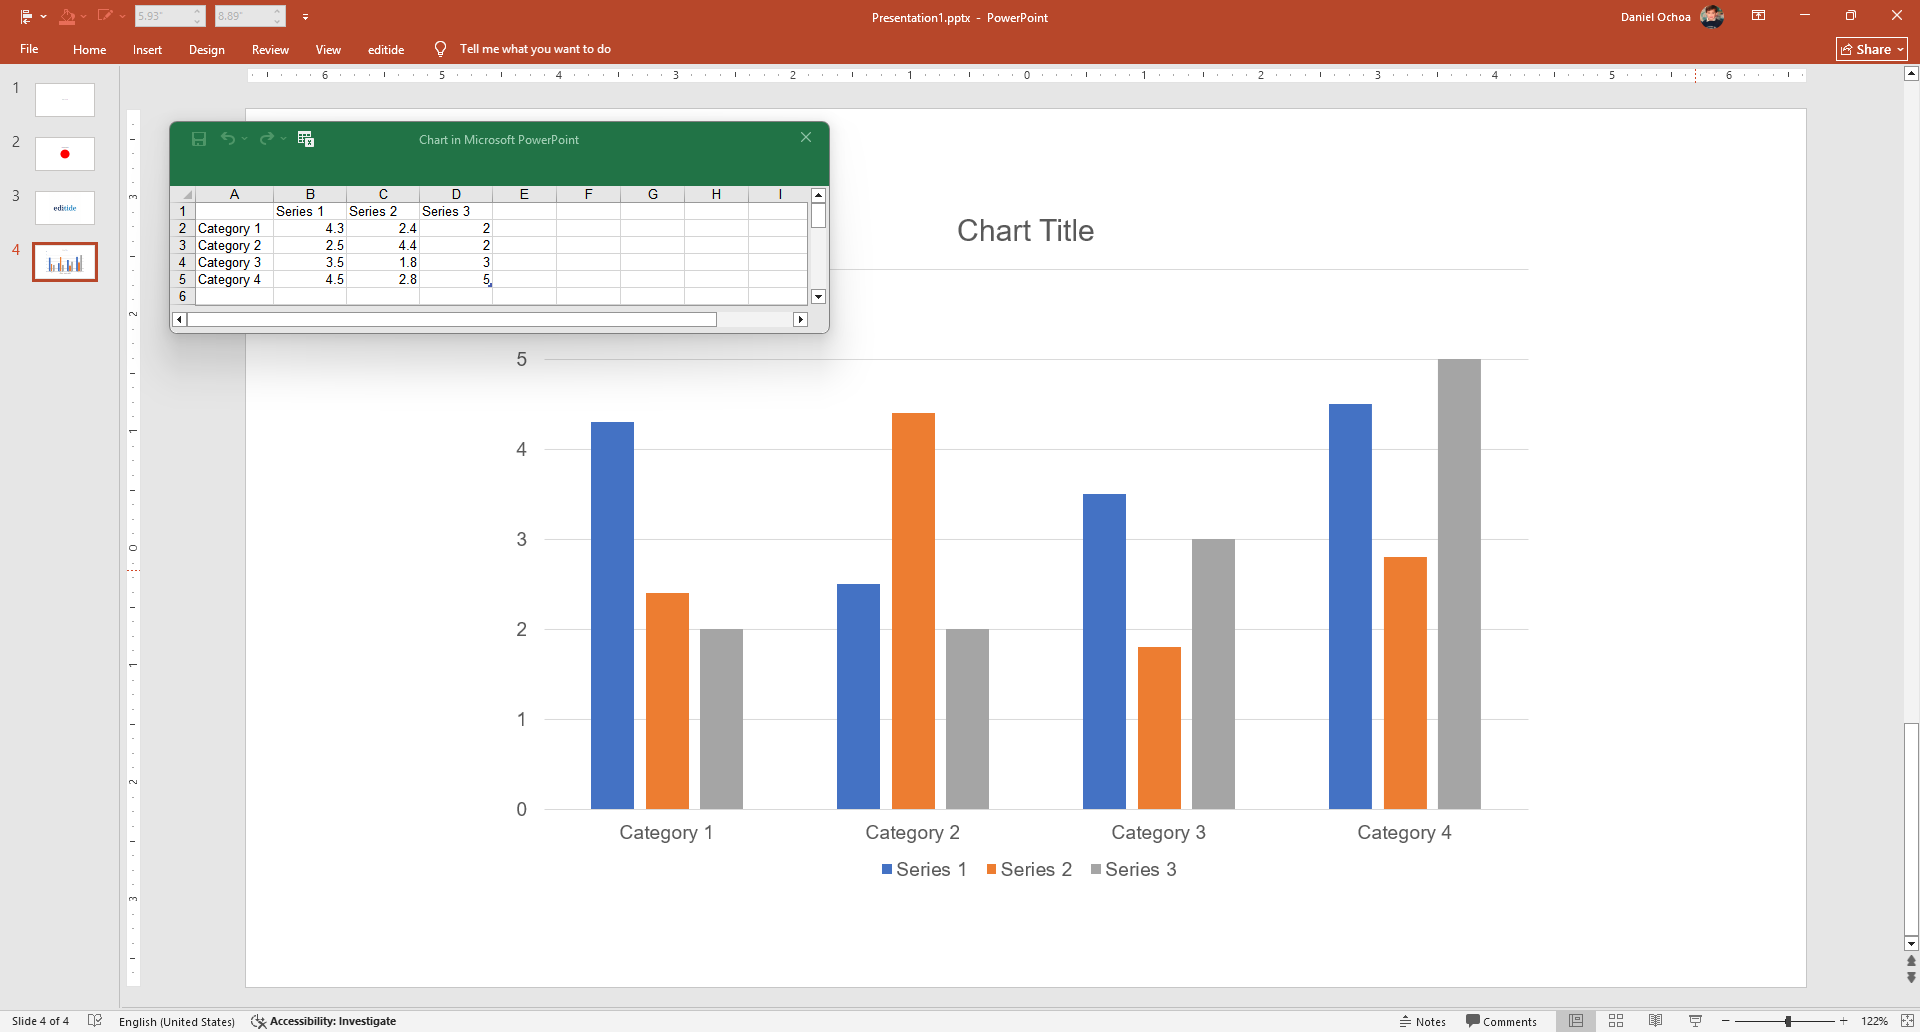
Then you make sure to reference that file when you write down the chart:
Slide 4
- Chart
  - Source = book1.xlsx
  - Height = 6 inches
  - Width = 9 inches
  - Position = 2.17 inches from the left edge, 0.75 inches from the top edge
  - Title = Chart Title
  - Show gridlines = true
  - Axis max = 6
  - Axis units = 1
  .
  .
  .
  - Series 3 fill = gray
The three dots above are doing a lot of work. Charts have A LOT of properties. You can make a single letter in one of the data labels bold, you can make the horizontal axis line thicker.
You'll likely have slides with multiple charts, so for your mental sanity you decide to move charts to their own files and use the same file referencing strategy you used for picture files and the Excel files.
You move the chart properties to their own
chart1.txt file and simplify the
slide4.txt file to:
Slide 4
- Chart
  - Source = chart1.txt
  - Height = 6 inches
  - Width = 9 inches
  - Position = 2.17 inches from the left edge, 0.75 inches from the top edge
The final folder ends up looking something like this:
presentation/
├── presentation_properties.txt
├── slides/
│   ├── slide1.txt
│   ├── slide2.txt
│   ├── slide3.txt
│   └── slide4.txt
├── pictures/
│   └── logo.png
├── excel/
│   └── book1.xlsx
└── charts/
    └── chart1.txt
Congratulations!
You recreated the basic architecture of .pptx files.
Under the hood, a .pptx file is a ZIP package
containing many individual files. And instead of our informal
.txt format, it uses structured XML text.
Try renaming one of your PowerPoint files from
.pptx to .zip and see for yourself.
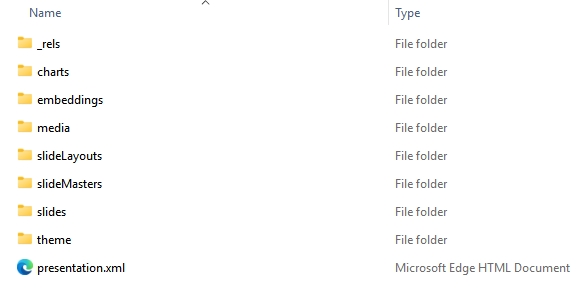
And inside the slides folder:
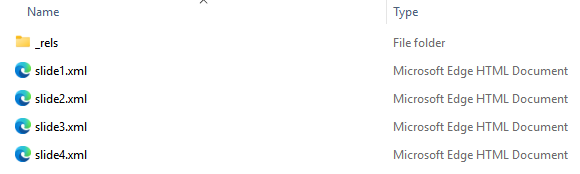
We didn't cover layouts or masters, but your folders map cleanly if you rename "excel" to "embeddings" and "pictures" to "media."
How is XML different from our simple text?
Let's actually unpack an excerpt from the
slide1.xml holding your simple "Hello world!" example.
<p:cSld>
  <p:spTree>
    <p:sp>
      <p:nvSpPr>
        <p:cNvPr id="5" name="TextBox 4">
          <a:extLst>...</a:extLst>
        </p:cNvPr>
        <p:cNvSpPr txBox="1"/>
      </p:nvSpPr>
      <p:spPr>
        <a:xfrm>
          <a:off x="5359675" y="3244334"/>
          <a:ext cx="1472650" cy="369332"/>
        </a:xfrm>
        <a:prstGeom prst="rect">
          <a:avLst/>
        </a:prstGeom>
        <a:noFill/>
      </p:spPr>
      <p:txBody>
        <a:bodyPr wrap="square" rtlCol="0">
          <a:spAutoFit/>
        </a:bodyPr>
        <a:lstStyle/>
        <a:p>
          <a:pPr algn="ctr"/>
          <a:r>
            <a:rPr lang="en-US" dirty="0"/>
            <a:t>Hello world!</a:t>
          </a:r>
        </a:p>
      </p:txBody>
    </p:sp>
  </p:spTree>
</p:cSld>
Unreadable machine garble.
It gets a little better if you swap the abbreviations for real words:
<CommonSlideData>
  <ShapeTree>
    <Shape>
      <NonVisualShapeProperties>
        <NonVisualDrawingProperties id="5" name="TextBox 4">
          <ExtensionList>...</ExtensionList>
        </NonVisualDrawingProperties>
        <NonVisualShapeDrawingProperties isTextBox="1"/>
      </NonVisualShapeProperties>
      <ShapeProperties>
        <Transform>
          <Offset x="5359675" y="3244334"/>
          <Extents width="1472650" height="369332"/>
        </Transform>
        <PresetGeometry shape="rectangle">
          <AdjustValues/>
        </PresetGeometry>
        <NoFill/>
      </ShapeProperties>
      <TextBody>
        <BodyProperties wrap="square" rightToLeftColumns="0">
          <ShapeAutoFit/>
        </BodyProperties>
        <ListStyle/>
        <Paragraph>
          <ParagraphProperties alignment="center"/>
          <Run>
            <RunProperties language="en-US" dirty="0"/>
            <Text>Hello world!</Text>
          </Run>
        </Paragraph>
      </TextBody>
    </Shape>
  </ShapeTree>
</CommonSlideData>
If you strip the XML scaffolding and less important attributes you'll get something like:
Slide
- Shapes
  - TextBox 4
    - X coordinate: 5,359,675
    - Y coordinate: 3,244,334
    - Height: 369,332
    - Width: 1,472,650
    - Preset Geometry: rectangle
    - No fill
    - Text: Hello world!
The position and size numbers are not in inches, but rather a unit called EMU — English Metric Unit. They're huge to avoid floating point numbers and just work with integers.
Close to your original .txt file!
The 18 font size and Arial font are missing, but you were expecting
this. You had written down fonts and font sizes in
presentation_properties.txt to avoid repeating yourself
on every textbox.
In a real .pptx file, theme font families can live in
theme1.xml in the theme folder:
<a:fontScheme name="Office">
  <a:majorFont>
    <a:latin typeface="Arial"/>
  </a:majorFont>
  <a:minorFont>
    <a:latin typeface="Arial"/>
  </a:minorFont>
</a:fontScheme>
So basically a .pptx file is a collection of XML files
with presentation data. There's a folder with individual files for
each slide. And there are a few more XML files for shared properties
like fonts that would be annoying to repeat over and over.
So editing PPTX is easy, right?
This all sounds simple enough. Give each slide a dedicated file listing out its properties, but make it more efficient by saving frequently used properties in a shared location.
The general premise is sound, but the actual implementation is incredibly messy.
In 2005, amid pressure from governments for open document standards, Microsoft submitted the OOXML (Office Open XML) formats to Ecma International for standardization. Ecma published the standard in 2006, and it was adopted as an ISO international standard in 2008.
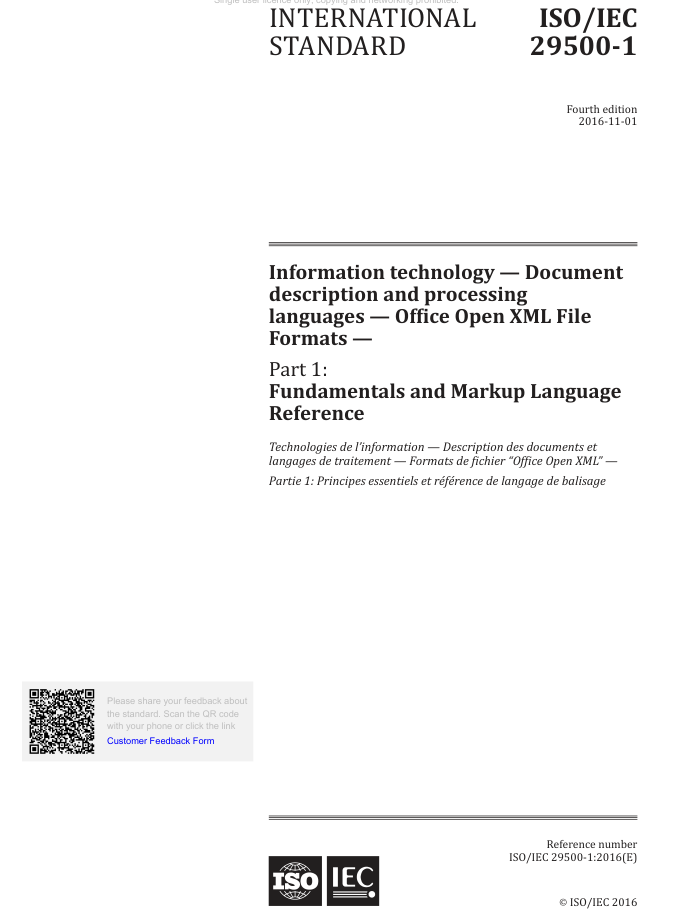
The main document is over 5,000 pages long. That's like 4 complete Lord of the Rings trilogies. Printed single-sided, the stack of paper would be about 20 inches (50 cm) tall.
Seems excessive?
The Document Foundation (creators of LibreOffice, the open source alternative to Microsoft Office) believes this is an intentional ploy by Microsoft to lock users into their ecosystem:
Unfortunately, while an XML schema can be simple, it can also be unnecessarily complex, bloated, convoluted and difficult to implement without specific knowledge of its features.
This artificial complexity is characterised by a deeply nested tag structure with excessive abstraction, dozens or even hundreds of optional or overloaded elements, non-intuitive naming conventions, the widespread use of extension points and wildcards, the multiple import of namespaces and type hierarchies, and sparse or cryptic documentation.
It's a satisfying theory. You can picture Bill Gates calling up Steve Ballmer: "Steve, I need the most evil engineers you can find. Bring me the team that worked on Clippy and Windows Update. I want our Office suite completely inaccessible to any competitor."
"Sure, let me pull them off the Vista project and send them your way."
It would certainly explain a lot of weird OOXML decisions.
Another less satisfying theory is: look, PowerPoint was created in 1987 and released on Windows in 1990. The engineers back then had no way of knowing what PowerPoint would become, or all the things it would be asked to accommodate. Middle school science teachers use it to present lectures with animations. Investment bankers use the same software to create materials for a board meeting approving public company mergers worth billions of dollars.
It's easy to criticize the architecture 40 years later with perfect hindsight and the accumulated knowledge of software engineering. OOXML itself is only about 20 years old, but it had to represent decades of PowerPoint features and existing presentations. It's possible OOXML is a mess for the same reason any 40-year-old codebase is a mess. Not just because of a committee, but because it made years of bolted-on features and compatibility decisions visible in a format that should never break.
Conclusion
A PowerPoint file is a ZIP package containing XML files and binary assets.
It stores all the properties you set in a PowerPoint presentation, and tries to organize them into separate files to avoid repetition and make things easier to locate.
Unfortunately, the actual implementation is a minefield with inheritance chains, strict element ordering, defaults set by the application, and other weird quirks.
That minefield is why automating PowerPoint with code is so hard. And by extension, it's why AI agents struggle with seemingly basic edits.
That mess is exactly what editide simplifies for AI agents.